JMeter Integartion with Influx DB and Grafana
JMeter Integration with Grafana + Influx DB for Real Time- Monitoring
System
Tools required for the set-up
·
Database: Prometheus or Influx DB.
·
Graphing Tool: Open Source Grafana
·
Testing Tool: Opensource Apache JMeter
Pre requisites
·
Apache JMeter should be
installed
·
JAVA latest version
should be configured in the system
·
Windows OS machine
Install Influx
DB
Step 1: Download Influx DB from below link
https://dl.influxdata.com/influxdb/releases/influxdb-1.8.0_windows_amd64.zip
Step 2: Once the installation
is done, open the Zip file and Navigate to influxdb.config file shown in below
fig:1.0

Fig:1.0
Step 3: Change Config in Influxdb.config as shown in below fig 1.2
and save it

Fig:1.2
Step 4:
·
Launch the Command Prompt (Windows+R; Type cmd)
·
cd
C:\Users\Downloads\influxdb-1.7.9_windows_amd64\influxdb-1.7.9–1
·
Type the below command
to initiate the DB server and click ‘Enter’
influxd.exe -config influxdb.conf
Or
Open influx application as shown in fig1.0
The InfluxDB application shown as below fig 1.3

Step 5:
·
Open the influx.exe file
in fig 1.0 To create DataBase.
·
Run
the "SHOW DATABASES" command – this will give you a list
of databases.
·
Run
the command: "CREATE DATABASE JMeter_Demo" - here
"JMeter-Demo" is the database name
·
Run SHOW
DATABASES again and you should see your new database listed
·
As
shown in fig 1.4

Fig
1.4
We all set the
InfluxDB.
2.JMETER SETUP:
- . .Install JMeter
- . Create a Test Plan
- . Add Thread Group
4. Here I will be one my
existing JMeter Test, we will see how to Configure the Backend Listener to write
metrix into influxDB
- Add a new backend listener to the thread group.
Right Click on a Thread Group -> Add -> Listener ->
Backend Listener
- Select influxdb.Backend.Listener in Implementation then we get the configurations as shown in below fig 2.0
6.

7: Set up config in Backend Listener to integrate with Influx DataBase
- InfluxdbMetricsSender – this is the class for sending metrics to
InfluxDB. We will keep it as default.
- InfluxdbUrl –
this is the URL of InfluxDB is in the following format: http://%5Binfluxdb_host%5D:%5Binfluxdb_port%5D/write?db=%5Bdatabase_name%5D.
As we have created the “JMETER_Demo”
database and we are running it on a local machine with a default port,
then, in our case, the URL will be http://localhost:8086/write?db=JMeter_Demo. (Change the URL)
Here
we set up the Listener in Jmeter
Now, Go for Grafana..
3.GRAFANA INSTALLATION
Step 1: click on
below link
https://grafana.com/docs/grafana/latest/setup-grafana/installation/windows/
·
select 7.3.7 version and win as shown
in fig 3.0
·
and download it

Fig
3.0
Step
2: Configure Grafana
·
The Grafana backend has a
number of configuration
options defined in its config file
(usually located at /etc/grafana/grafana.ini on Linux systems).
Step
3: start Grafana Application file,
Double click on Grafana-server as shown in below Fig 3.1
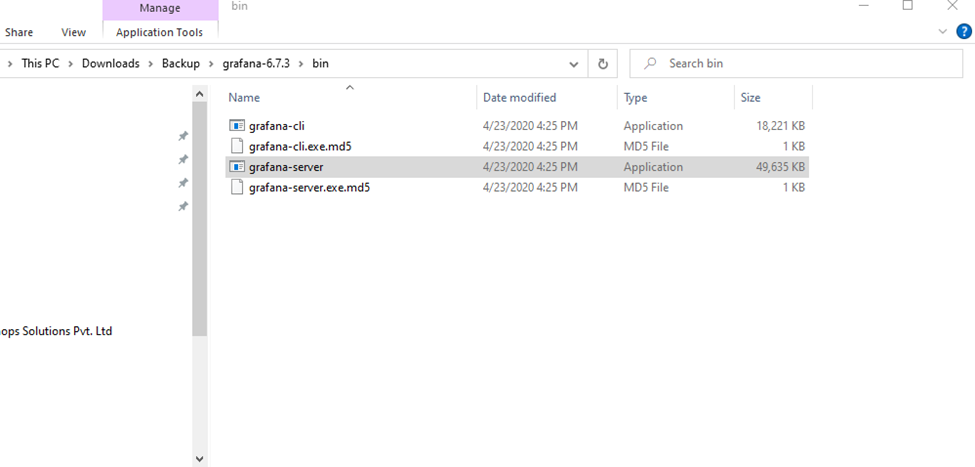
Fig 3.1
OR
Start
Server:
Open
cmd from /bin path
Give command “start Grafana-server.exe”, as shown fig3.2

Fig
3.2

Step 4: Open Grafana UI in Browser
1. As
soon as the server initiates, you can launch Grafana in your choice of Browser.
The tool listens to the port
3000>> http://localhost:3000/
(Fig 3.3)

Fig 3.3
Use Credentials: Username: admin /Password:
admin
Step 5: Add Data Source
1.Go to configurations.
2.Click on Add data source
3.select or search for influx DB as
shown in fig 3.4

Fig
3.5
4.
It opens settings
- ·
Check Name
- ·
Check URL as per
given in fig 1.5 if not paste the url from Jmeter to here.
- ·
Provide Data Base
Name “JMeter_Demo” in Influx DB Details
- ·
Select HTTP
Methods-> GET
- ·
After providing
details, click on Save and text
- ·
Select backend
time interval 5S
·
AS per shown in
below fig 3.6.1 and 3.6.2
·
It should pop up a tiny
Connection successful.


Fi g 3.6.1
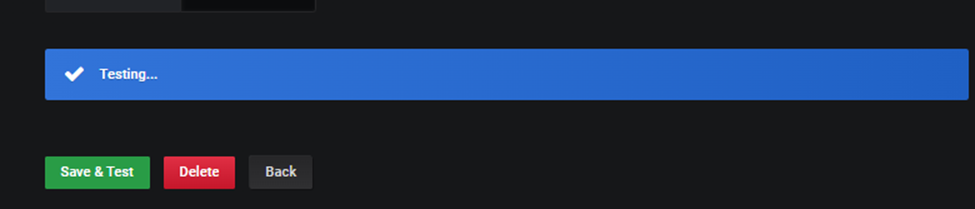
Fig
3.6.2
Step 6: create First Grafana Dash Board
1. Go to create (+)
2. Click on import
3. Type Dashboard ID 5496
4. Click on load
Ref the fig 3.7

Fig 3.7
Step 7: it shows gig 3.8 after load the dashboard
·
Provide name as per you are wish
·
Select General Folder
·
Select the Data Base Name as shown
in Fig 1.5(URL)
· Click on Import( as per shown in Fig 3.8)

Fig
3.8
Step
8: Open the summary report after you
Import the Dashboard

Fig
3.9
v Now we can run our JMeter test and result
observed here as a real Time Monitoring system
Note:This
is the report generated by me Using JMeter Integration with Grafana and Influx
DB

Thank you
Comments
Post a Comment